
Notice
Recent Posts
Recent Comments
Link
| 일 | 월 | 화 | 수 | 목 | 금 | 토 |
|---|---|---|---|---|---|---|
| 1 | 2 | 3 | 4 | 5 | ||
| 6 | 7 | 8 | 9 | 10 | 11 | 12 |
| 13 | 14 | 15 | 16 | 17 | 18 | 19 |
| 20 | 21 | 22 | 23 | 24 | 25 | 26 |
| 27 | 28 | 29 | 30 |
Tags
- 머신러닝
- pyplot
- 지니계수
- decisiontree
- Python
- matplotlib
- bar
- Heatmap
- confusion matrix
- scatter
- sklearn
- ml
- XGBoost
- Golang
- GINI
- gini coefficient
Archives
- Today
- Total
목록bar (1)
Passion, Grace & Fire.
 pyplot : bar
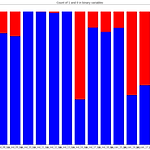
bar plot의 경우 bottom에 기존에 그린 데이터를 넘겨 bar를 쌓을 수 있다. import matplotlib.pyplot as plt zero_list = [360852, 442223, 497644, 484917, 594990, 594205, 589594, 594648, 201882, 523143, 503879, 522342, 221514, 265356, 424278, 387469, 503955] one_list = [234360, 152989, 97568, 110295, 222, 1007, 5618, 564, 393330, 72069, 91333, 72870, 373698, 329856, 170934, 207743, 91257] features = ['ps_ind_06_bin', 'ps_i..
pyplot
2020. 8. 21. 10:02