
Notice
Recent Posts
Recent Comments
Link
| 일 | 월 | 화 | 수 | 목 | 금 | 토 |
|---|---|---|---|---|---|---|
| 1 | 2 | 3 | 4 | 5 | ||
| 6 | 7 | 8 | 9 | 10 | 11 | 12 |
| 13 | 14 | 15 | 16 | 17 | 18 | 19 |
| 20 | 21 | 22 | 23 | 24 | 25 | 26 |
| 27 | 28 | 29 | 30 |
Tags
- decisiontree
- scatter
- Python
- 머신러닝
- matplotlib
- pyplot
- Golang
- bar
- gini coefficient
- XGBoost
- 지니계수
- sklearn
- Heatmap
- confusion matrix
- ml
- GINI
Archives
- Today
- Total
목록Heatmap (1)
Passion, Grace & Fire.
 pyplot : heatmap
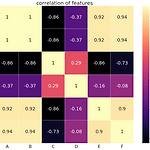
heatmap은 색상표에 기반하여 데이터를 시각화하는 그래픽 표현이다. 머신러닝 분야에서는 여러개의 feature에 대해 feature 간 연관성(상관관계)를 시각화하려고 할 때 많이 사용된다. 상관관계가 높은 feature들은 줄일 수 있기 때문에 성능개선에 도움이 된다. feature마다의 상관관계(correlation)를 heatmap으로 표현하는 예제 코드이다. 먼저 데이터를 준비한다. import pandas as pd import matplotlib.pyplot as plt import seaborn as sns data = {'A' : [1, 0, 3, 2, 4, 5, 8], 'B' : [1, 0, 3, 2, 4, 5, 8], 'C' : [7, 6, 3, 4, 5, 2, 1], 'D' : [..
pyplot
2020. 8. 26. 13:37